SAST — Static analysis
Static Application Security Testing scans the source code you wrote — before it runs — to find vulnerabilities like injection, cross-site scripting, hard-coded secrets and broken access control. CodesGuard traces how untrusted data flows to dangerous sinks, then runs an AI review over each finding to score how likely it is to be a false positive.
What SAST is (and when to use it)
SAST reads your code without executing it. It's the earliest place to catch security bugs — you don't need a running server, a deployed environment, or a test account, just the source. Use SAST to answer: “Is there a vulnerability in the code my team wrote?”
The engine auto-detects the languages and frameworks in your upload, parses the code into a model of how data moves through it, and applies security rules to find places where untrusted input (a request parameter, a form field, a header) reaches a sensitive sink (a database query, an HTML response, a shell command) without being properly sanitized.
How a scan works
When you start a scan, CodesGuard runs a four-stage pipeline over your uploaded source:
- Parse
The engine unpacks the archive, detects languages and frameworks, and builds a structural model of the code.
- Trace dataflow
It follows tainted input from sources to sinks across functions and files, building the evidence path behind each potential vulnerability.
- Apply rules
Security rules (mapped to CWE and OWASP categories) flag the risky patterns it found.
- AI review
Each candidate finding is reviewed by an AI pass that judges exploitability and assigns a false-positive probability — see The false-positive score.
Step 1 — Create a project
Open SAST from the sidebar and click New project. A
project is a container for one codebase and its scan history. Give it a name (for example,
payments-api) and an optional description.
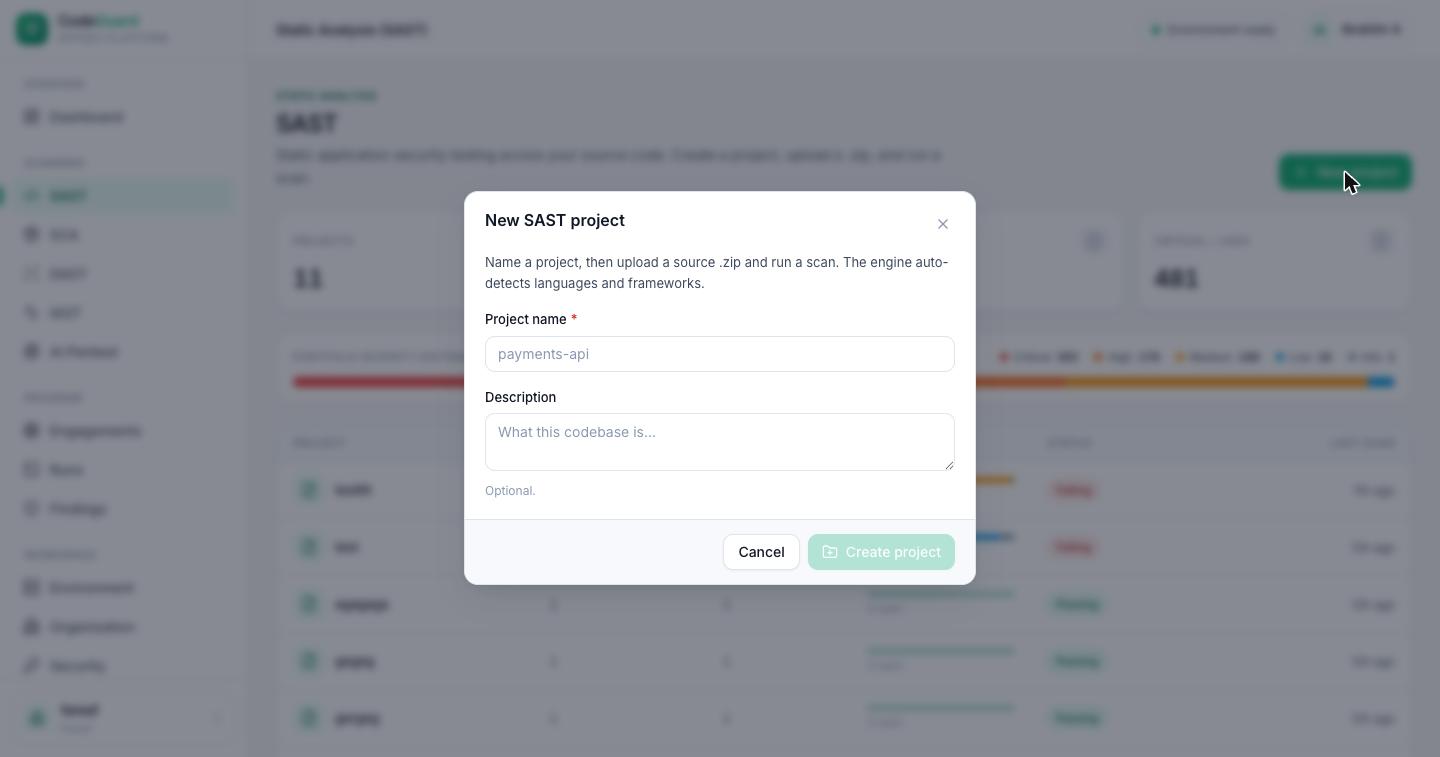
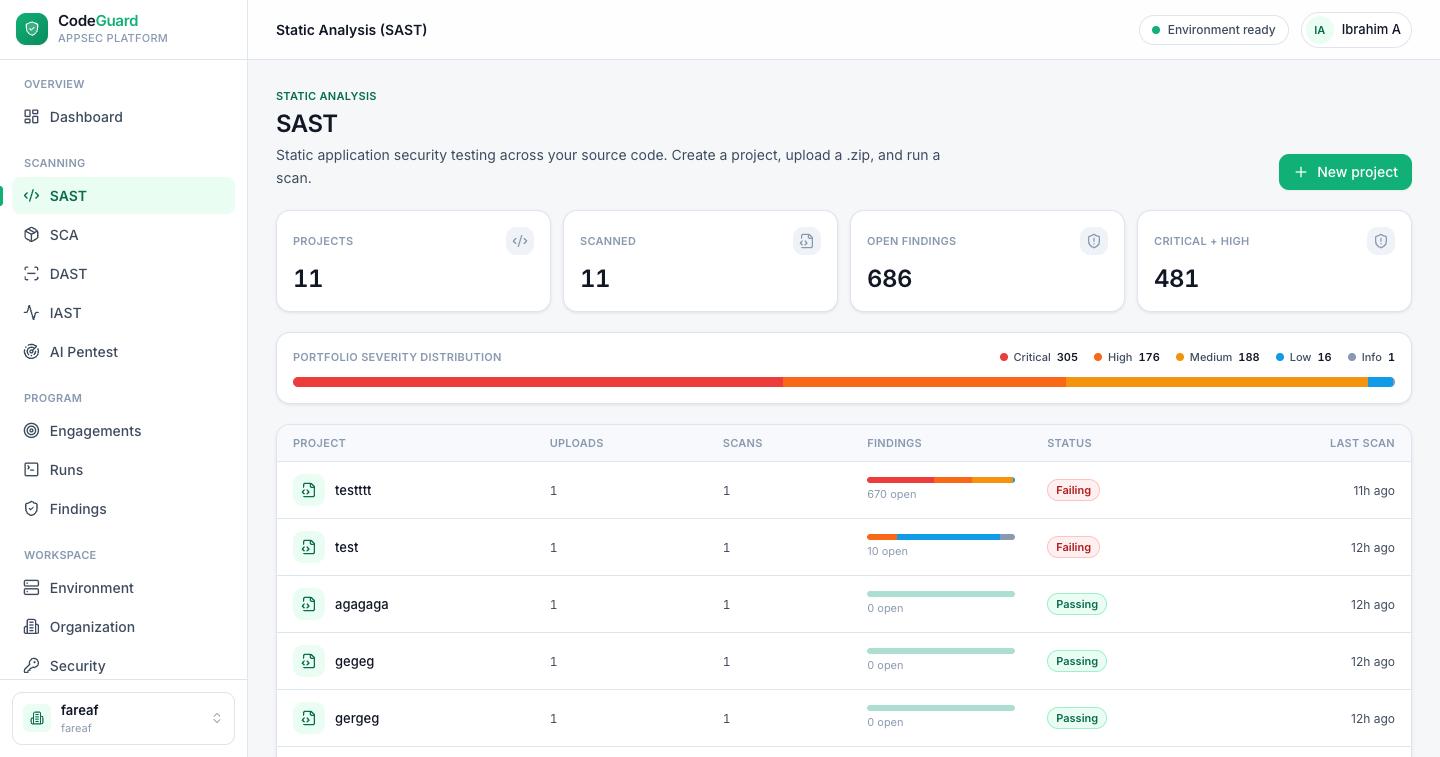
Your projects are listed on the SAST home page with a portfolio-wide severity distribution and each project's latest status — Passing or Failing.
Step 2 — Upload your source code
Open the project and click Upload .zip. CodesGuard accepts a single
.zip archive of your source tree (no git URL is required). The uploader adapts
to the file size automatically:
- Small archives upload in one request.
- Large archives are split into chunks and uploaded piece by piece, then reassembled — so big codebases upload reliably. A progress bar shows Uploading… then Finalizing…
composer.json,
package.json, requirements.txt). You don't need to include
build artifacts or node_modules. Maximum upload size depends on your plan —
see Billing.
Step 3 — Run the scan
Once an upload is ready, Start scan becomes available. A scan moves through these states, and the page polls for progress automatically:
While it runs, CodesGuard shows: “Scanning source — the engine parses the code, traces dataflow, and runs AI review. This can take a few minutes on a large codebase.” You can keep working elsewhere and come back; results appear on the project as soon as the scan completes.
Analysis settings (optional)
Two choices under Project → Settings change what a scan looks for. Both are off unless you turn them on.
Treat stored data as untrusted
By default a scan follows data from the point it enters your application. With this on it also follows data read back out of your database or session — which is how an attack that was saved earlier reaches a victim later (often called stored XSS or SQL injection).
Turn it on when you are auditing an application that stores and re-displays what users submit. Expect more findings, and a higher share of false alarms among them.
Allow internet access while building
Some projects generate part of their own code at build time, and the tool that does it downloads something first. Without internet access that step cannot run, so the scanner never sees the code it would have produced.
Private package registries (optional)
Most companies keep some of their own code in an internal package registry — the shared libraries several of your applications reuse. Those packages are not on the public registry, so by default a scan cannot read what they declare, and anything your code does through them stays unresolved. That shows up as a lower-quality scan for a reason that has nothing to do with the code you uploaded.
You can fix that from Project → Settings → Private package registries. Add one entry per registry:
- Kind of packages — which package manager fetches from it.
- Address — where the registry lives.
- How it signs in — a username and password, a token, or nothing at all if the registry is open to anyone who can reach it.
- Only for this namespace (optional) — send just one group of packages there.
- Also serves public packages (optional) — if the registry proxies the public one too.
Private registries are used by the deeper resolution tiers. If your plan runs scans at a depth that does not fetch dependencies, the scan will say your registries went unused rather than quietly ignoring them — and if an entry could not be applied for any other reason, the scan says which one and why.
Step 4 — Read the results
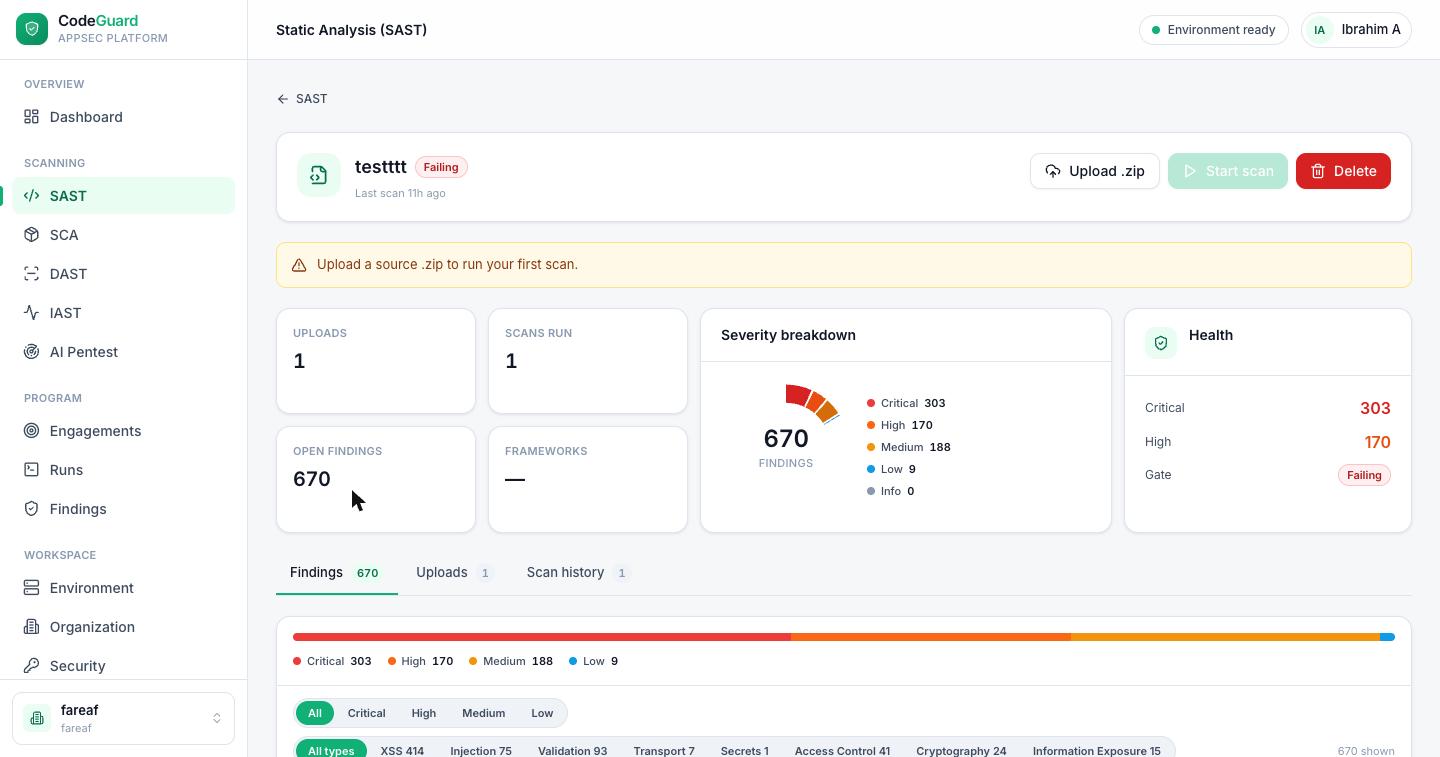
A completed scan gives you a project overview plus a filterable list of findings. The overview summarizes the whole codebase:
Severity levels
Every finding carries one of five severities:
The gate
The Health / Gate card gives the project a single pass/fail verdict, Failing or Passing, decided by your workspace's scan policy. Until you change it, a scan fails on any open critical or high finding — in your code or in your dependencies — on a malicious package, or on a package whose license your license policy denies. The card says which policy judged the scan and what it fails on, and every scan carries its verdict: the scan page, the project list, the report and a CI job's exit status all show the same one.
Owners and admins set the policy for the whole workspace on the Organization page, and a project can have its own (the project's Settings tab → Scan policy → Customize). A policy can fail scans on a severity threshold (in code, in dependencies or both), count dependency findings only when a fix exists, fail on known-exploited vulnerabilities, on an exploit-likelihood threshold or on advisories older than a number of days, and judge a pull request only on what it introduces. Changing the policy judges your scans again at once — no rescan — and so does marking a finding remediated or not processed, deciding on a package, or stating that an advisory does not affect you.
When part of the analysis did not finish, the gate says Gate not decided instead of passing on results that are incomplete. Run the scan again.
Compared with the previous scan
A scan shows what is new and what was fixed since the scan it is compared with — the project's previous scan, or, for a scan your CI pipeline starts for a pull request, the latest scan of the branch the pull request targets. A code finding is matched by a fingerprint that survives the code around it moving, a dependency finding by its package and advisory, so moving a line or adding an unrelated file does not make findings look new.
Downloads
Download on the scan page lets you choose what to download:
The findings list
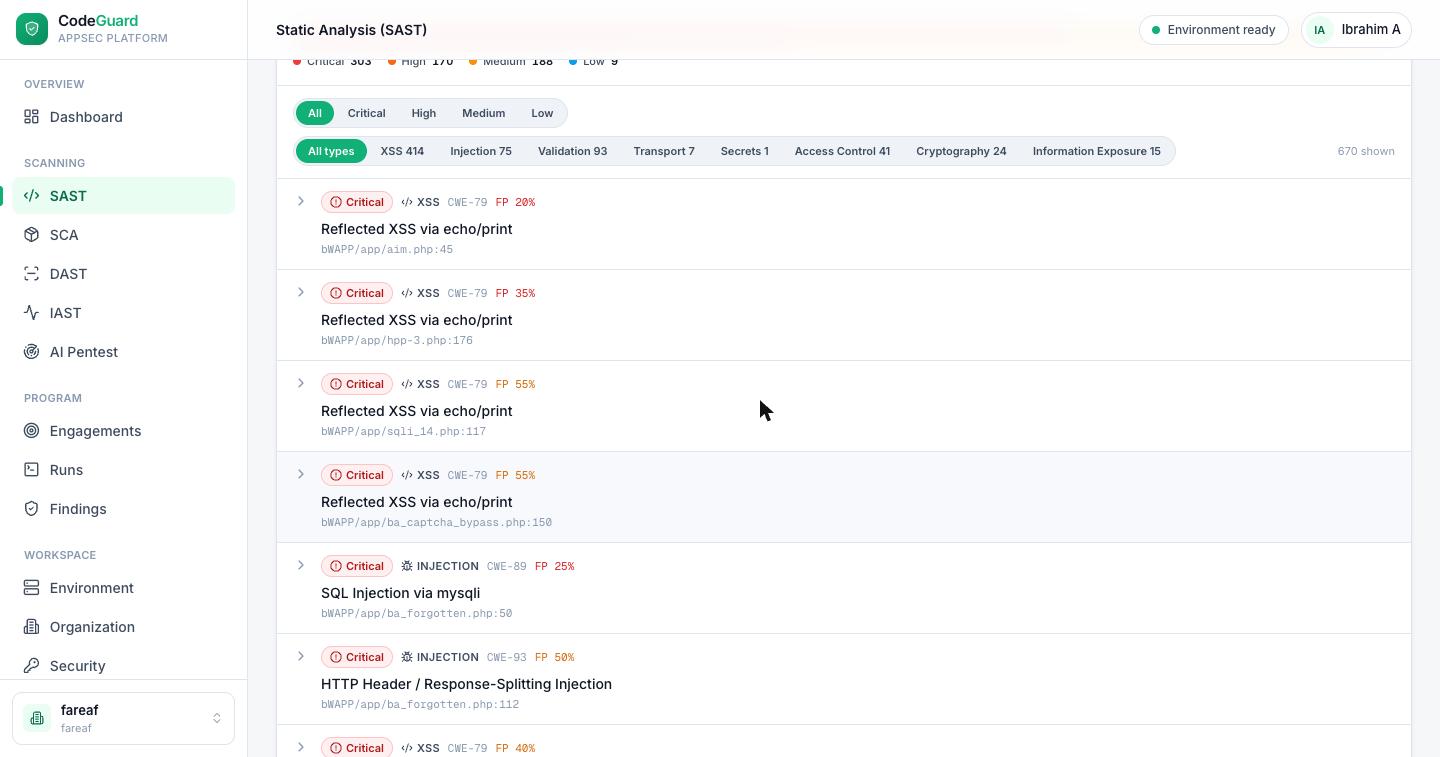
Under the Findings tab, each finding is a row you can expand. The row
shows the severity, the finding type (XSS, Injection, Secrets, Access Control…), its CWE ID,
an FP % score, a human-readable title, and the exact
file:line location. You can filter by severity, by finding type, and toggle
Hide likely FP to drop the noisiest low-confidence results.
Anatomy of a finding
Expand a finding to see the full evidence behind it:
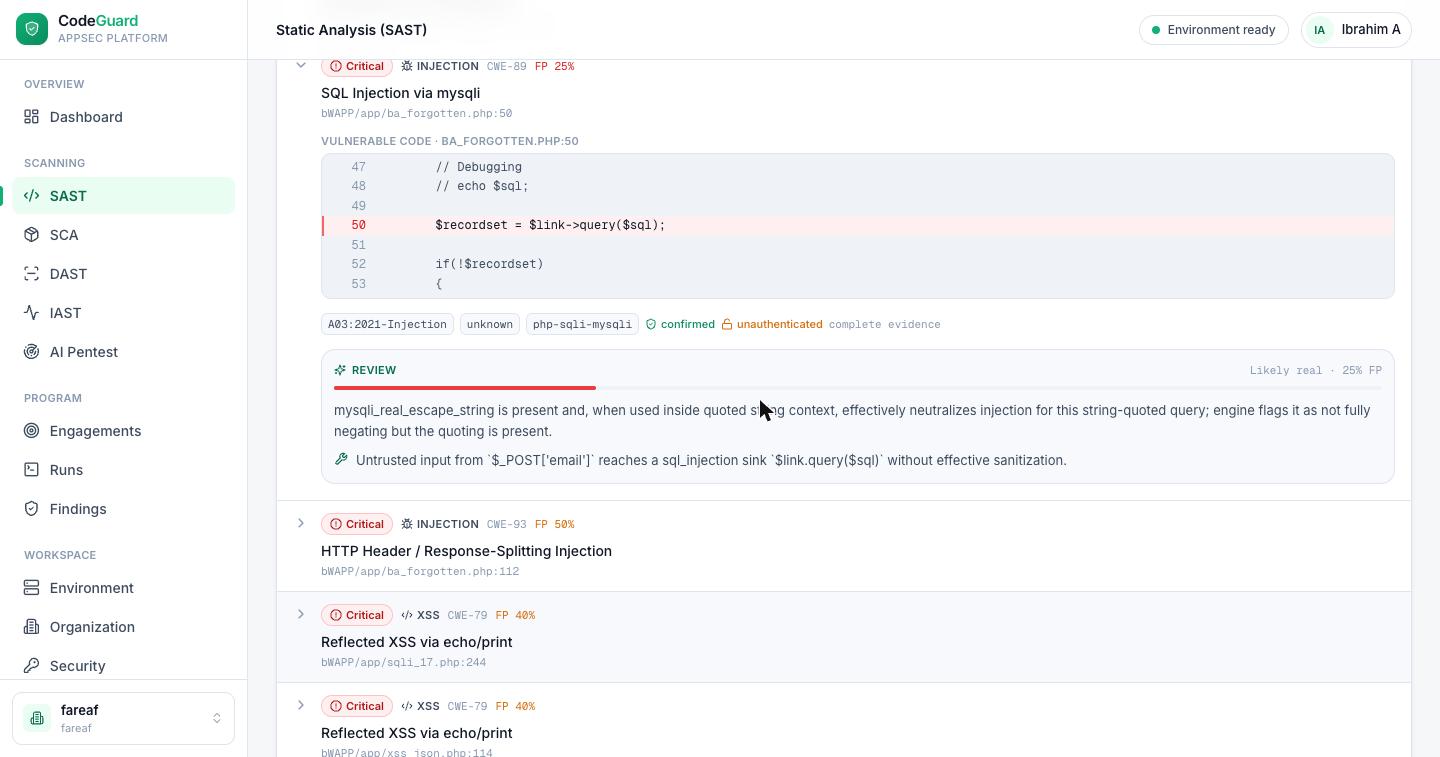
- Vulnerable code — the relevant source lines with the sink line highlighted.
- Classification — the OWASP category (e.g.
A03:2021-Injection), the rule that matched, and the framework. - Evidence signals — confirmed, whether the path is reachable unauthenticated, and whether the dataflow evidence is complete.
- Dataflow trace — a plain-language path, e.g. “Untrusted input from
$_POST['email']reaches a sql_injection sink$link->query($sql)without effective sanitization.” - AI review & fix — the false-positive verdict and a recommended fix.
The false-positive score (FP %)
Traditional static analysers are notorious for noise — they flag hundreds of “potential” issues, most of which aren't real, and teams give up wading through them. CodesGuard tackles this head-on: after the engine finds a candidate, an AI review pass examines the actual code and dataflow and assigns each finding a false-positive probability, shown as FP %.
Why score instead of just flag?
A binary “vulnerable / not vulnerable” label forces the engine to choose between missing real bugs (too strict) or drowning you in noise (too loose). A probability lets you triage by confidence: fix the low-FP criticals first, and skim or hide the high-FP long tail. It turns an unmanageable wall of alerts into a ranked worklist.
How the score is used
CodesGuard reads the FP score in three ways so you rarely have to think about it:
In the example above, the SQL-injection candidate scored 25% FP → “Likely
real”. The review explains its reasoning — it noticed
mysqli_real_escape_string is present but concluded the quoting doesn't fully
neutralize the injection — and confirms the tainted path from $_POST['email']
to the query sink. That transparency is the point: you see why the score is what
it is, not just a number.
Managing scans & projects
Each project keeps its full history so you can track progress over time:
- Analysis tab — the latest completed scan, with a dropdown to view older scans.
- Scan history tab — every scan with its status, start time, source archive, duration, severity mini-bar and finding count.
- Uploads tab — the source archives you've uploaded.
Control actions:
Access & plans
SAST requires an active workspace, and creating projects requires an owner/editor role. SAST is included on every paid plan; the number of projects and monthly scans you get depends on your subscription — see Billing & plans. If a module is later removed from your plan, its historical results become read-only rather than disappearing.